To enable the scripting with R and the visualize with Power BI you need firstly install a R Server on your local computer: https://mran.revolutionanalytics.com/download
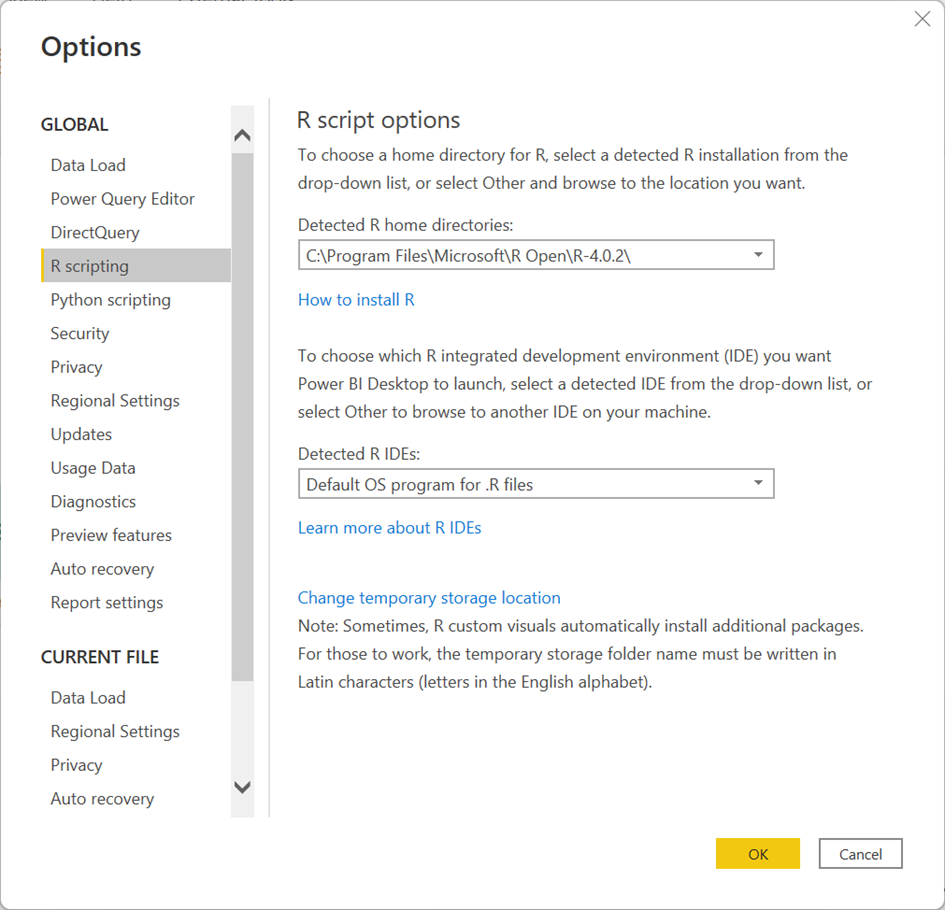
After the installation of the server you need to enable this on your Power BI Desktop by navigating to the options:
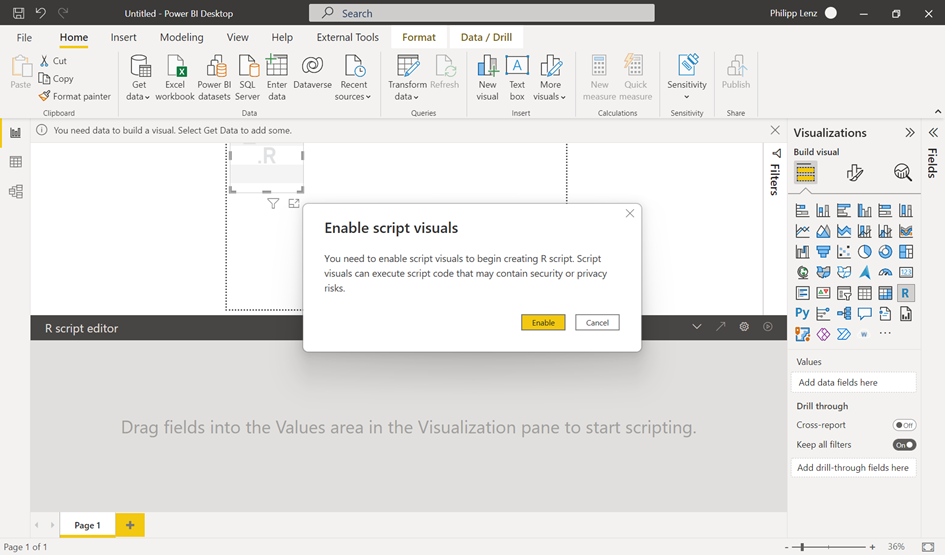
Now you can add a R visual to your Report:
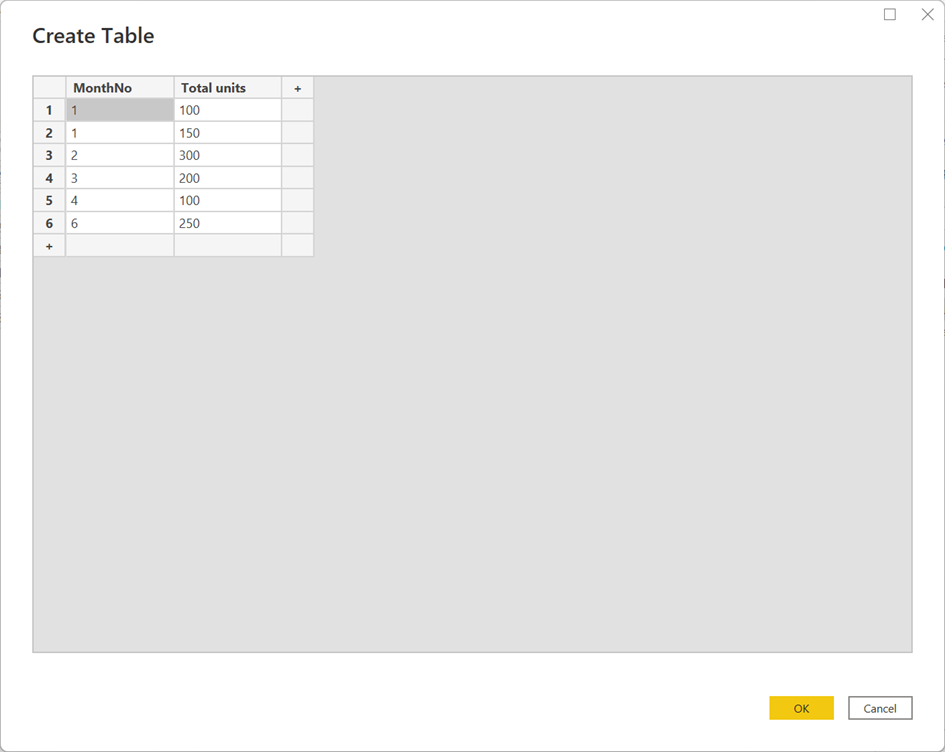
To get some data, you can manually add some data
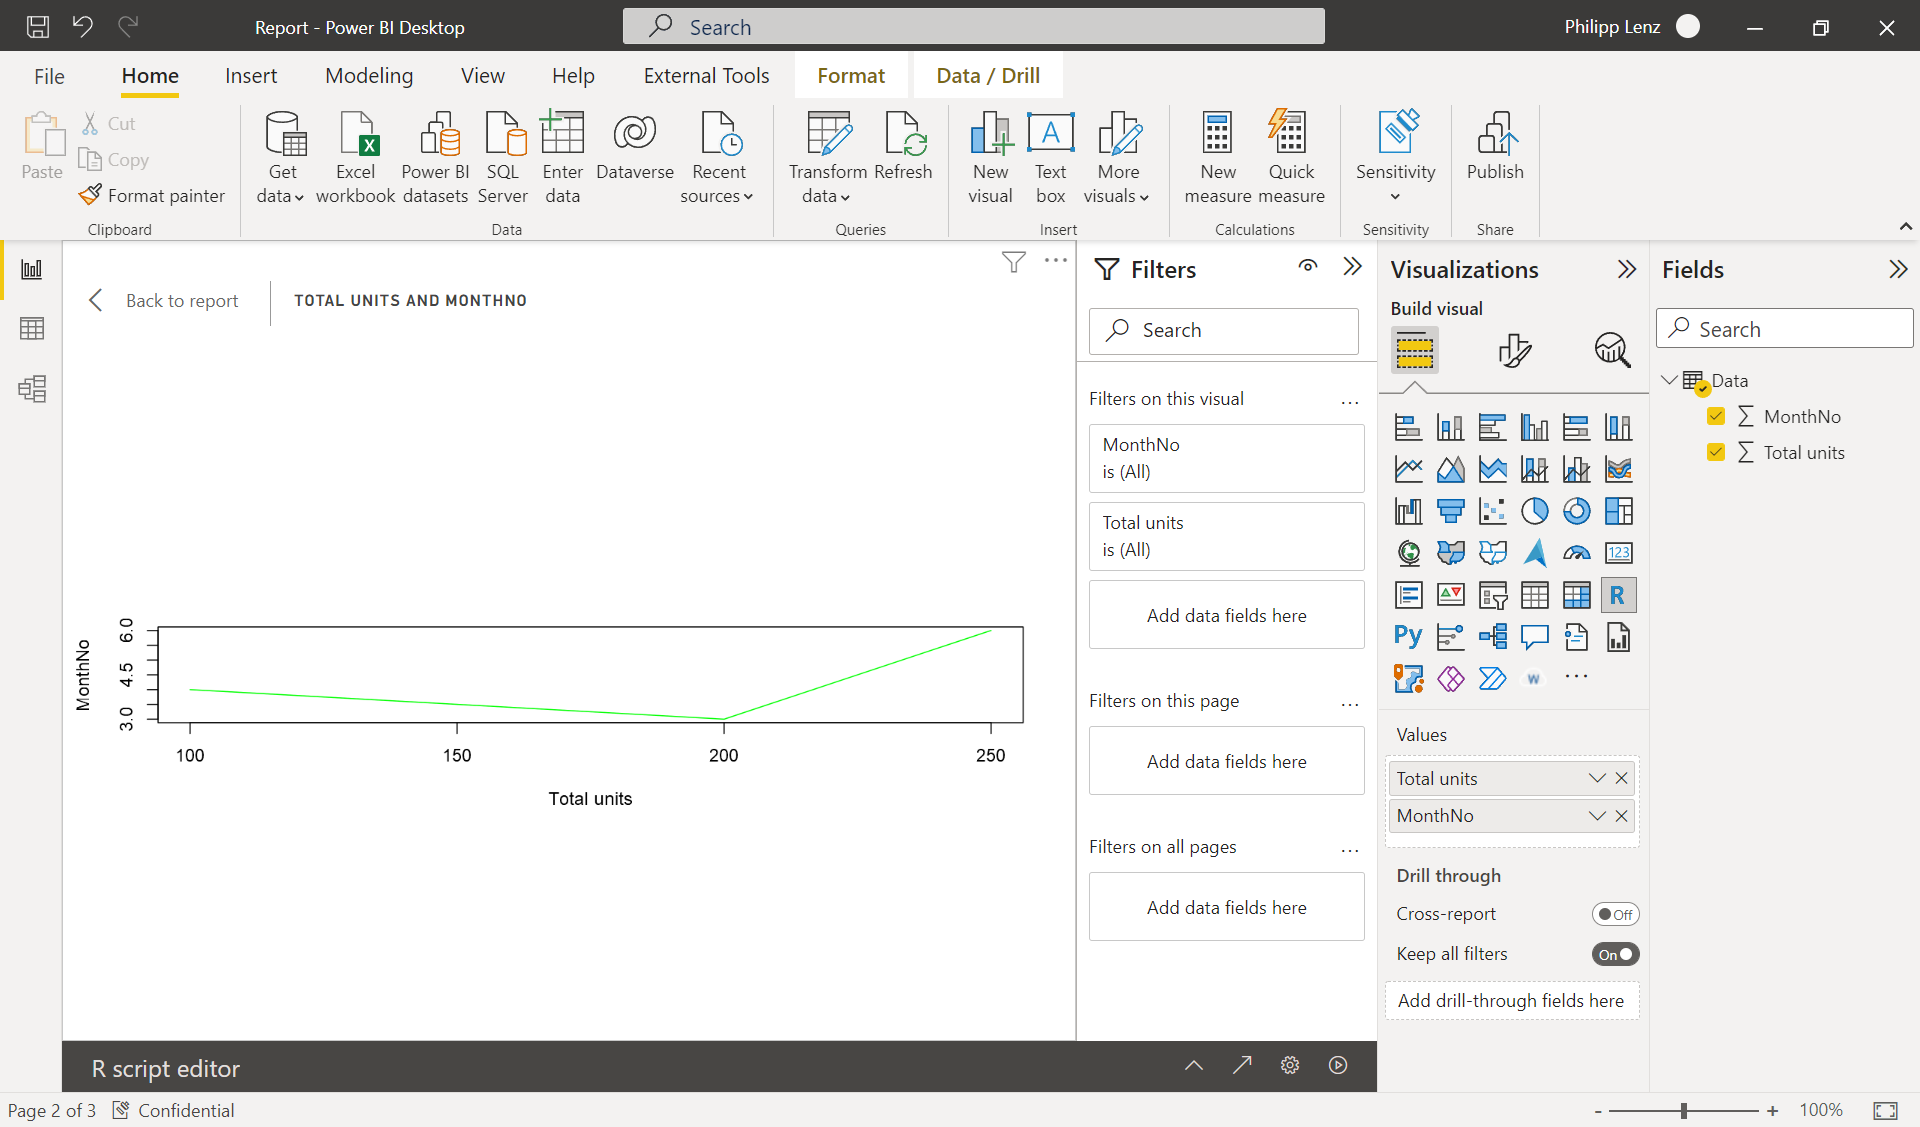
After adding some data, you can add the columns of your table to the visual

After that, you can add this sample code to create your first visualization:
x <- dataset[,1] # get the first column from dataset
y <- dataset[,2] # get the second column from dataset

columnNames = colnames(dataset) # get column names

plot(x, y, type="n", xlab=columnNames[1], ylab=columnNames[2]) # draw empty plot with axis and labels only
lines(x, y, col="green") # draw line plot
N
Here are some limitations:
- R visuals support is limited to the packages identified in Learn which R packages are supported. There currently is no support for custom packages.
- Data size limitations – data used by the R visual for plotting is limited to 150,000 rows. If more than 150,000 rows are selected, only the top 150,000 rows are used and a message is displayed on the image. Additionally, the input data has a limit of 250 MB.
- If the input dataset of an R Visual has a column that contains a string value longer than 32766 characters, that value is truncated.
- Resolution – all R visuals are displayed at 72 DPI.
- Plotting device – only plotting to the default device is supported.
- Calculation time limitation – if an R visual calculation exceeds 60 seconds the script times out, resulting in an error.
- R visuals are refreshed upon data updates, filtering, and highlighting. However, the image itself is not interactive and does not support tool tips.
- R visuals respond to highlighting other visuals, but you cannot click on elements in the R visual in order to cross filter other elements.
- R visuals are currently not supported for the Time data type. Please use Date/Time instead.
- R visuals do not display when using Publish to web.
- R visuals do not support renaming input columns. Columns will be referred to by their original name during script execution.
- R visuals currently do not print with reports printing.
- R visuals are currently not supported in the Direct Query mode of Analysis Services.
- R visuals have the ability to convert text labels into graphical elements. Doing so in the Power BI service requires the following additional step:
Here you can find more information
https://docs.microsoft.com/en-us/power-bi/visuals/service-r-visuals