In my last post, I demonstrated how parameters in a Power BI semantic model can be updated using PowerShell. This is particularly useful when these parameters are used in queries and displayed to the user, allowing them to deduce the data’s origin—for example, whether it’s test or production data.
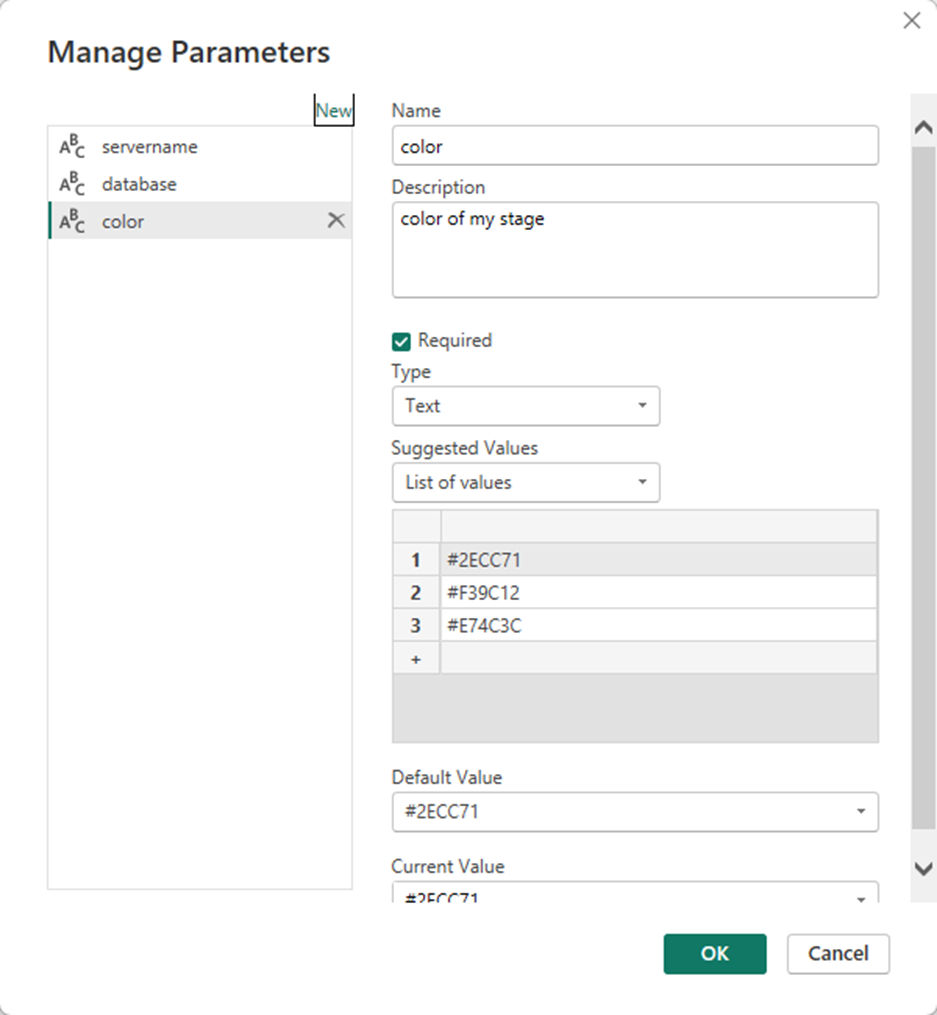
In my model, I created three parameters:
1. Server Name
2. database name
3. Environment Color—this simply indicates the environment. This could, of course, also be a text value that then determines the color. How this is implemented, or whether it’s even necessary, is up to the developer.
The first two parameters can then be used in the M code to parameterize the queries against the source.
To use these three parameters, they must be written to a table. Direct access to the M parameters is not possible this way. But that’s not a big deal; if these values are written to a table using M code, the semantic model will need to be updated anyway when the parameters change, because a new source also changes the data. For this purpose, I create the following structure in my model using an empty query:
let
    Server = #"servername",
    Database = #"database",
    color = #"color",
    Tbl =
        #table(
            type table [ServerName = text, DatabaseName = text, color = text ],
            {{Server, Database, color}}

        )

in

    Tbl
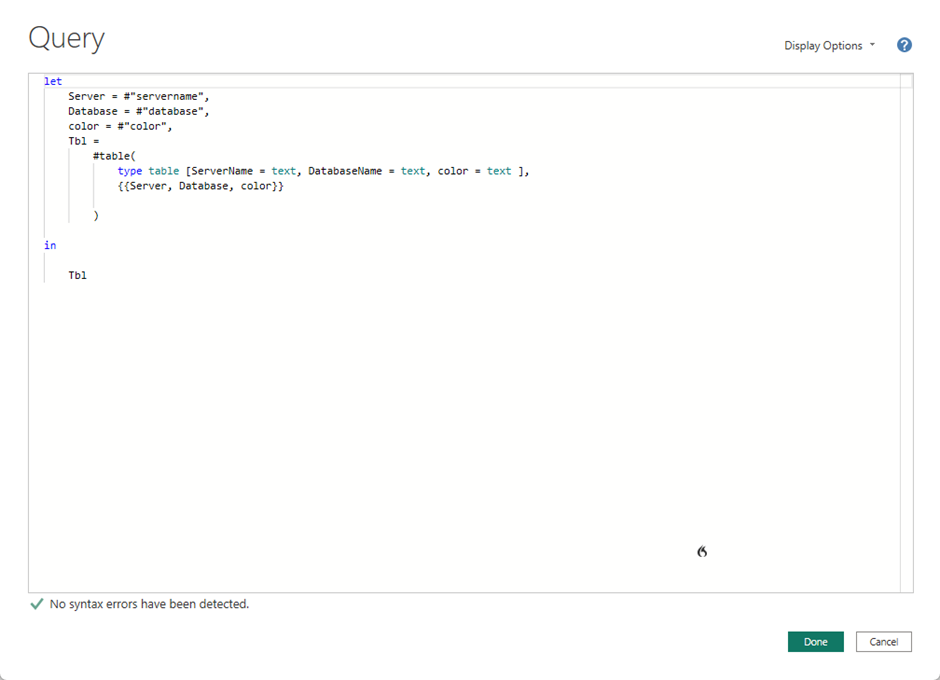
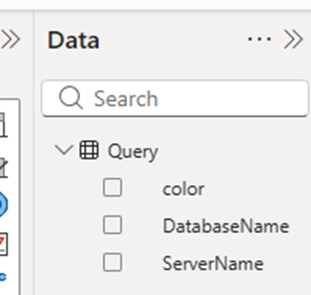
This transfers the parameter values into a table.
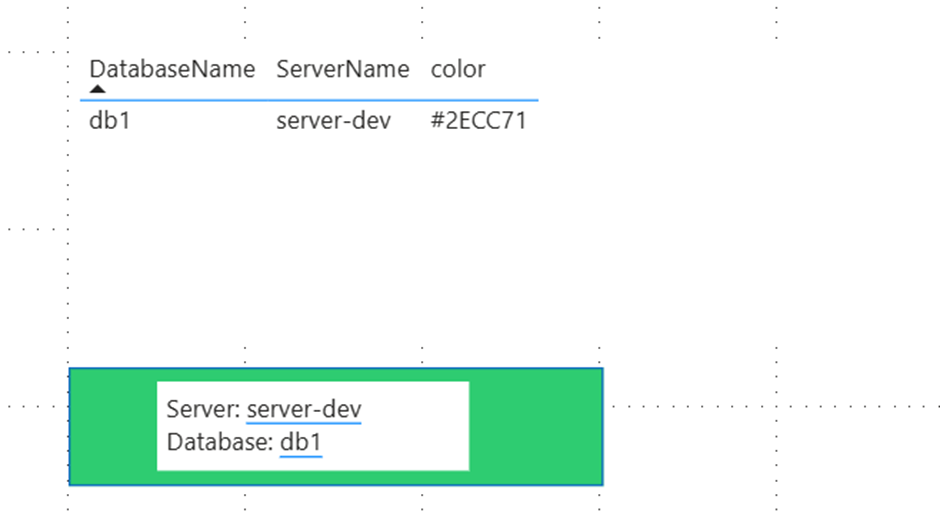
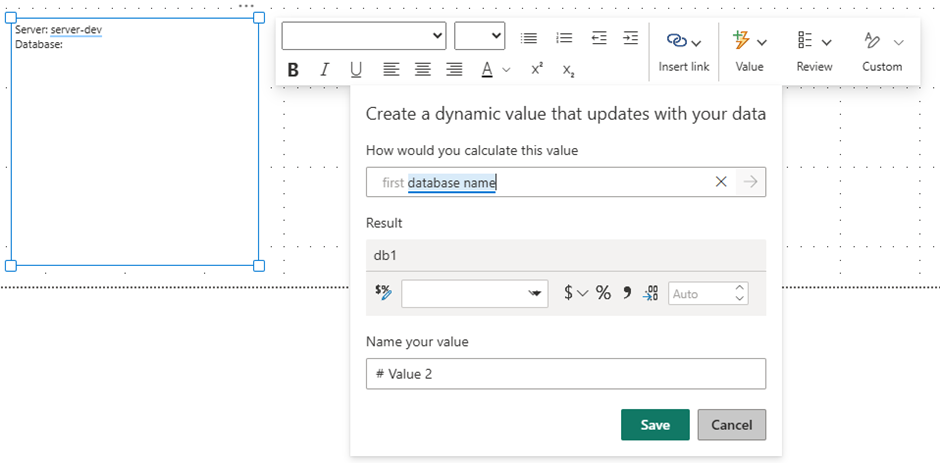
I like to use the Narrative Visual for ads like these. It allows me to integrate my own text and values from tables, saving me the trouble of creating measures and concatenating text.
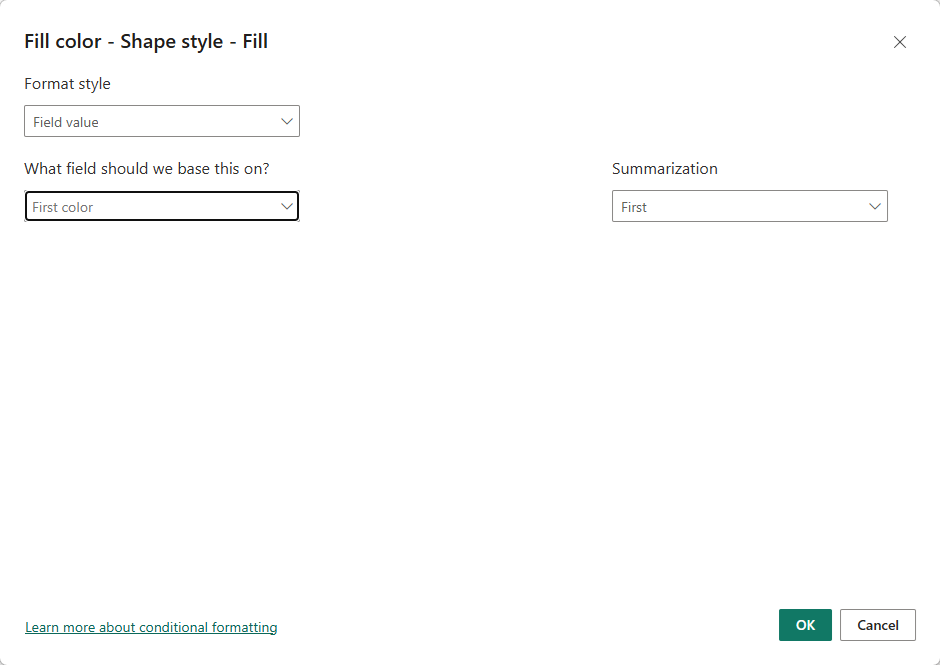
To display the color, I use a simple rectangle and set the color as the background color. Then I place the newly created visual over the rectangle.
I think it looks better than a table like the one shown in the screenshot below. Of course, it could be made even more aesthetically pleasing, but for this entry, I believe it’s perfectly adequate.