Okay, I think this is not a topic for Power BI, because normally I build a SCD in a Data Mart with T-SQL and not with M/PowerQuery for an Self Service Environment. But in some cases it should be very useful like an PoC. Another reason in an self service scenario can be, that you have a small amount of data and you will analyze them with an history and an correct mapping.
Well, let’s take a look to the data:
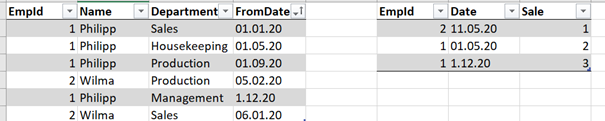
On the left you will see the employees and you see which employee are assigned to which department with an timestamp. On the right side you have the facts, so Wilma has an sales mount on the 5th of November. The correct department for this timestamp is the Sales Department. When you build up a data model with Power BI with this tables, you can only join the tables via the EmpId and you can not see which department do this sale, only the employee and you did not see the correct assignment. So, you need an surrogate key which is unique and created for the timestamp and can merge the two tables.
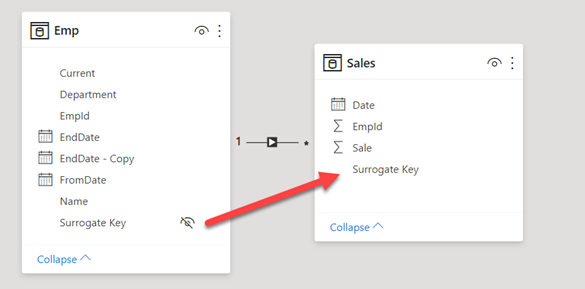
We need a data model like this:
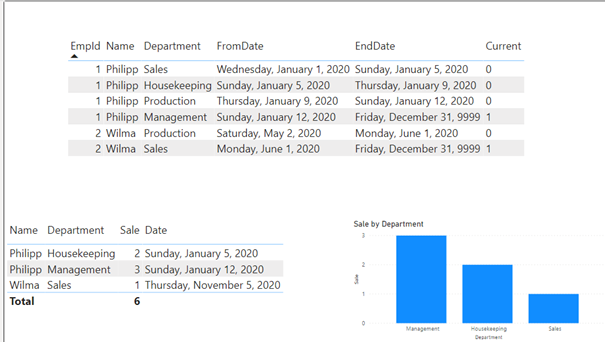
… with this result:
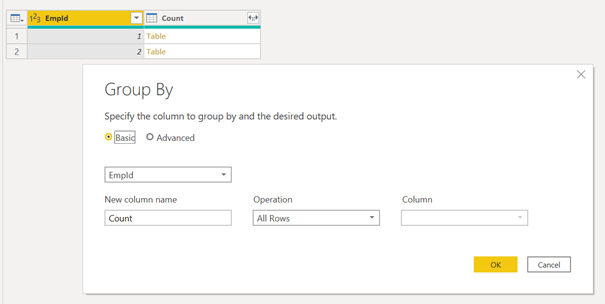
The Counter Table
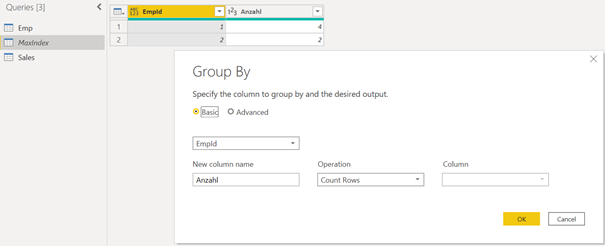
First we must import the Emp.-Table and group it by the count of the EmpId. We need this to check how much rows we have for which employee and mark the latest record.
The name of this table is “MaxIndex”
This table is only need for our ETL process and we can disable the loading, because we don’t need it on our data model.
The Emp-Table
To do this, we must start with the Employee (Emp) table and load it into PowerQuery and sort it by EmpId and Date:
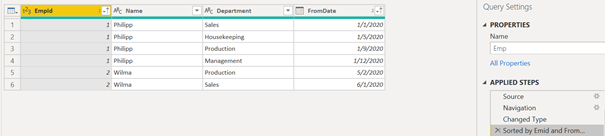
- To sort by two or more columns you need to do some M scripting:
#"Sorted by EmpId and FromDate" = Table.Sort(#"Changed Type",{{"EmpId", Order.Ascending}, {"FromDate", Order.Ascending} }),
2. Next we must group the data by the EmpId
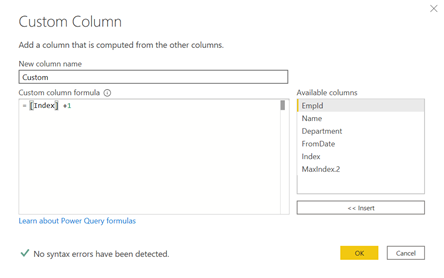
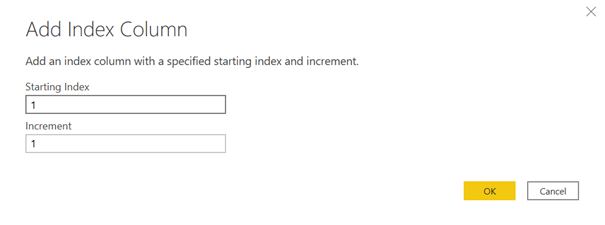
3. The we must add an index

- Then we can remove the other columns except the new Custom column and expand it.
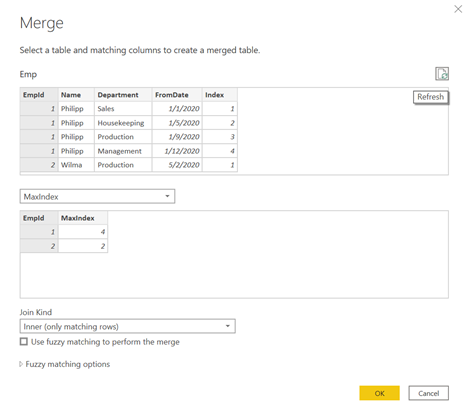
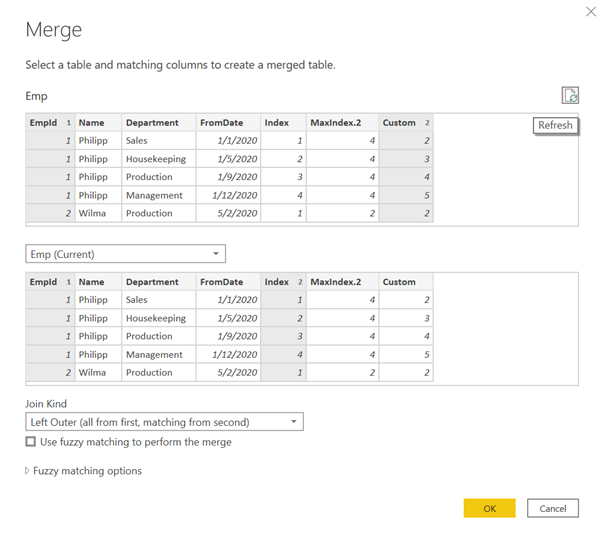
- Next we can merge it with the MaxIndex table and expand the Row Count (MaxIndex)
- Now we must determine the next row and we add a number to the Index
- After that we can join this table with it self by the EmpId and the index and the new column. Then we can expand the column and we only need the FromDate column which we can rename this as EndDate.
- Then we can check if the index equals the MaxIndex column and if it’s match, we know this is the last entry.
- Next we can adjust the End Date, if it’s null, we can set it to 12/31/9999
- Now we can add the surrogate key
- After that there is only to do some renaming and subtract one day of the end day, so you don’t have an overlapping of the start and end date.
The fact table
- After you have loaded the fact into PowerQuery you can merge it with the Emp table by using the EmpId. You can expand the columns Start Date, End Date and the Surrogate Key.
- After that you can add a M Step to filter the data:
#“Filtered Rows“ = Table.SelectRows(#“Expanded Emp“, each [Date] >= [Emp.FromDate] and [Date] < [Emp.EndDate]),
- Now you can remove the Start and End Date and load the data to your model
That’s it, There are many steps to to and you will find the PBIX file for download. I think the steps can be more simplified, but for this approach it’s okay. But please aware of the amount of data, if you have more than 1 Mio. Fact rows, please build it with T-SQL or another database engine.