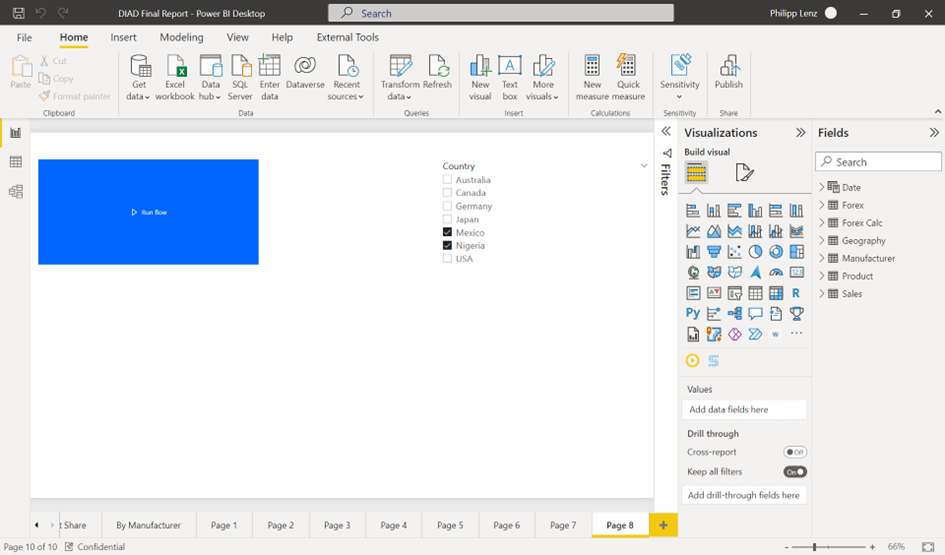
Inside Power BI you have access to the Power Automate visual. With that, you can create and trigger flows and give your users more possibilities to interact with your data. This post shows you, how your users can send out information’s. So, I have created y report based on the Dashboard in a Day data with a country slicer and I have added a Power Automate visual. To the visual I have added the country column and a measure,
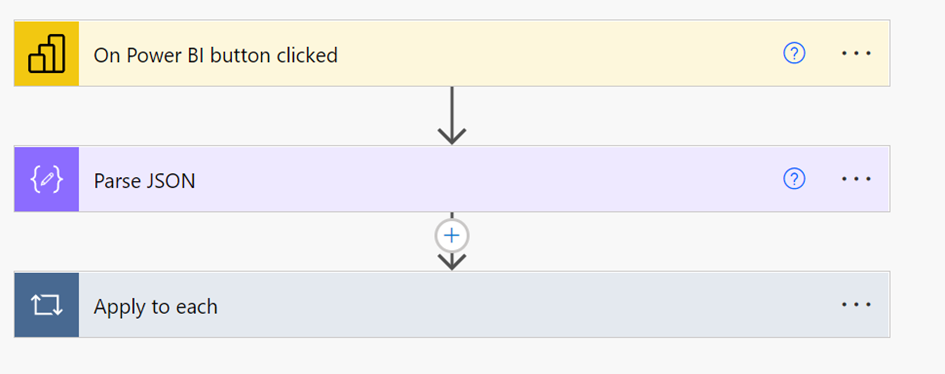
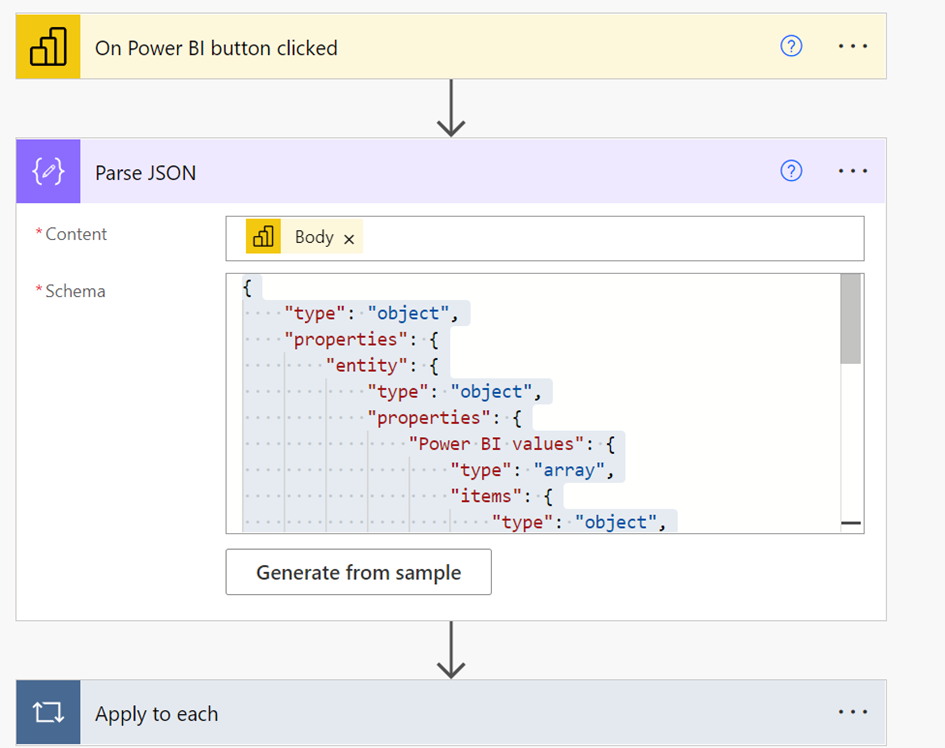
Inside the flow I have added a parsing JSON and an email task. The JSON task is needed to get out the fields of the sanded data.
Inside the task I have added a sample of the provided JSON. To get another one you can debug the flow and can get out an example.
{
    "type": "object",
    "properties": {
        "entity": {
            "type": "object",
            "properties": {
                "Power BI values": {
                    "type": "array",
                    "items": {
                        "type": "object",
                        "properties": {
                            "Country": {
                                "type": "string"
                            },
                            "Sales": {
                                "type": "number"
                            }
                        },
                        "required": [
                            "Country",
                            "Sales"
                        ]
                    }
                }
            }
        }
    }
}
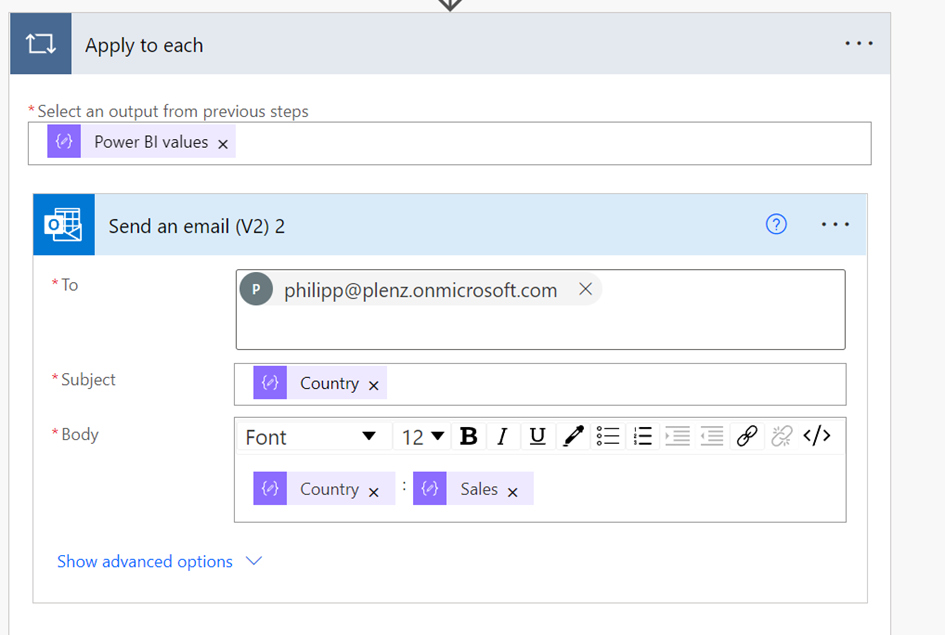
Inside the email task, I have added a fixed email address. This can also be provided by data driven. Next you can format your email.
After saving the flow, you can trigger them by filtering the data by using the slicer and clicking the button. It is easier by doing this at the service canvas.

Now your users will receive the selected information.
