In many organizations, organizational structures, cost center hierarchies, or product groups are not stored as traditional hierarchies with fixed levels. Instead, they are modeled as so-called parent-child structures, where each organizational unit only references its immediate parent.
While this approach provides a high degree of flexibility and simplifies maintenance, it can become challenging when visualizing the data in Power BI. Hierarchy slicers, matrix visuals, and drill-down scenarios typically require separate hierarchy levels. In addition, hierarchies with varying depths often result in unwanted (Blank) values within reports and visualizations.
In this article, I will demonstrate how a parent-child hierarchy can be transformed into a report-friendly structure by using the PATH() function, the new DAX User Defined Functions (UDFs), and TMDL. Furthermore, I will show how to eliminate unwanted blank values while preserving the complete hierarchy structure.
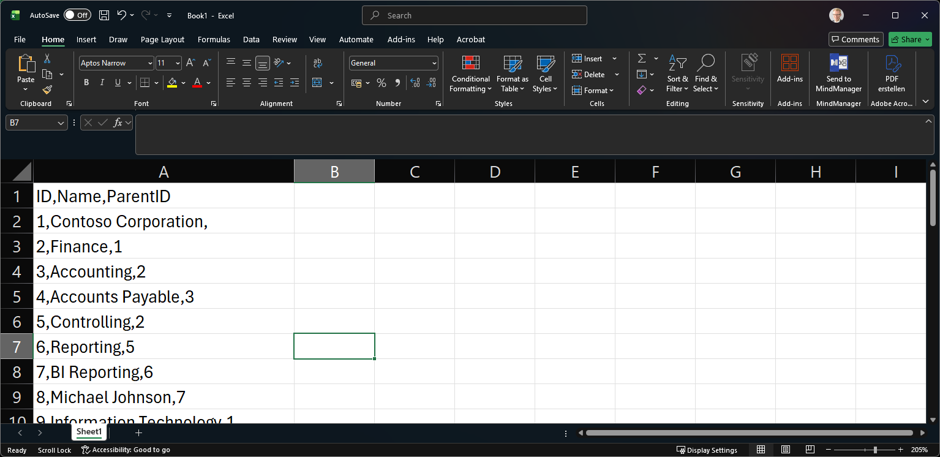
The organizational structure is stored in a simple parent-child table. Each row contains a unique ID and references its parent organizational unit through the ParentID column.
Example
Contoso Corporation
└─ Finance
   └─ Accounting
      └─ Accounts Payable
For example, Finance has a ParentID of 1 and therefore belongs to Contoso Corporation. Likewise, Accounting has a ParentID of 2 and therefore belongs to Finance.
| ID | Name | ParentID |
|---|---|---|
| 1 | Contoso Corporation | |
| 2 | Finance | 1 |
| 3 | Accounting | 2 |
| 4 | Accounts Payable | 3 |
To make the hierarchy usable in Power BI, the complete path from the root node to the current element must be generated.
Hierarchy Structure
Contoso Corporation > Finance > Accounting > Accounts Payable
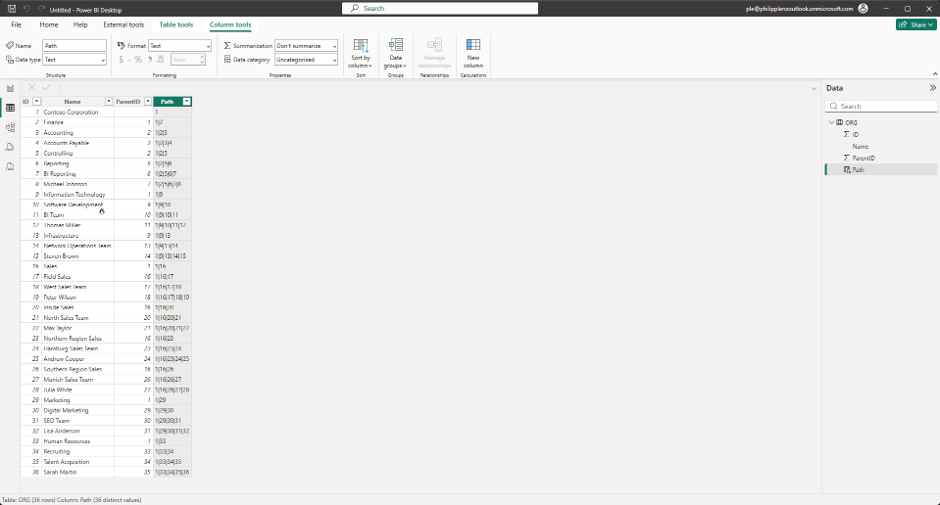
In DAX, this can be achieved using the PATH() function:
Path =
PATH ( ORG[ID], ORG[ParentID] )
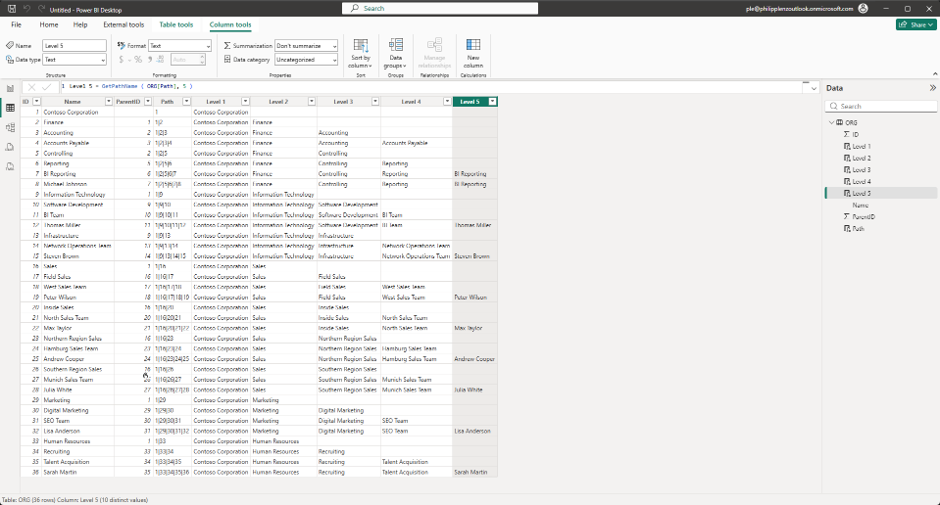
The resulting path contains the IDs of all hierarchy levels:
| ID | Name | ParentID | Path |
|---|---|---|---|
| 1 | Contoso Corporation | 1 | |
| 2 | Finance | 1 | 1 |
| 3 | Accounting | 2 | 1 |
| 4 | Accounts Payable | 3 | 1 |
At this stage, the hierarchy is available as a technical path and can be further transformed into report-friendly hierarchy levels.
After creating the hierarchy path using the PATH() function, the organizational structure initially exists only in a technical format. The path contains nothing but the IDs of the individual hierarchy levels.
Example
1|2|3|4
While this representation is ideal for calculations, it is difficult to interpret in reports and visualizations. Business users typically want to see meaningful organizational names rather than technical identifiers.
To make the hierarchy usable for reporting, the individual IDs within the path must be translated back into their corresponding organizational unit names. This is where the new DAX User Defined Functions (UDFs) come into play. Instead of implementing the same logic repeatedly for every hierarchy level, the logic can be defined once and reused throughout the model.
As a result, the technical path:
1|2|3|4
can be transformed into a user-friendly hierarchy:
Level 1 = Contoso Corporation
Level 2 = Finance
Level 3 = Accounting
Level 4 = Accounts Payable
Using a UDF provides several benefits:
- The DAX code becomes significantly easier to read and maintain.
- The logic only needs to be maintained in a single location.
- Additional hierarchy levels can be added more easily.
- The calculations can be reused throughout the entire model.
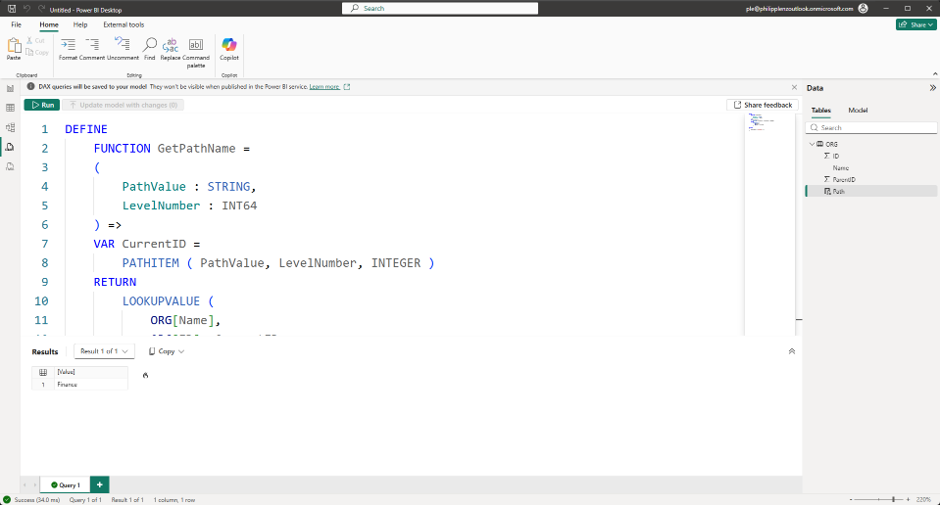
The primary purpose of the function is to transform the technical parent-child structure into a readable hierarchy that can be used in hierarchy slicers, matrix visuals, and other reporting scenarios.
DEFINE
    FUNCTION GetPathName =
    (
        PathValue : STRING,
        LevelNumber : INT64
    ) =>
    VAR CurrentID =
        PATHITEM ( PathValue, LevelNumber, 1 )
    RETURN
        LOOKUPVALUE (
            ORG[Name],
            ORG[ID], CurrentID
        )

EVALUATE
{
    GetPathName ( "1|2|3|4", 2 )
Before creating the individual hierarchy levels, a reusable DAX User Defined Function (UDF) is defined using TMDL. The purpose of this function is to extract a specific level from the hierarchy path and return the corresponding organizational unit name.
By implementing the logic once within a reusable function, the same code does not have to be repeated for every hierarchy level. This results in a cleaner, more maintainable, and easier-to-extend model.
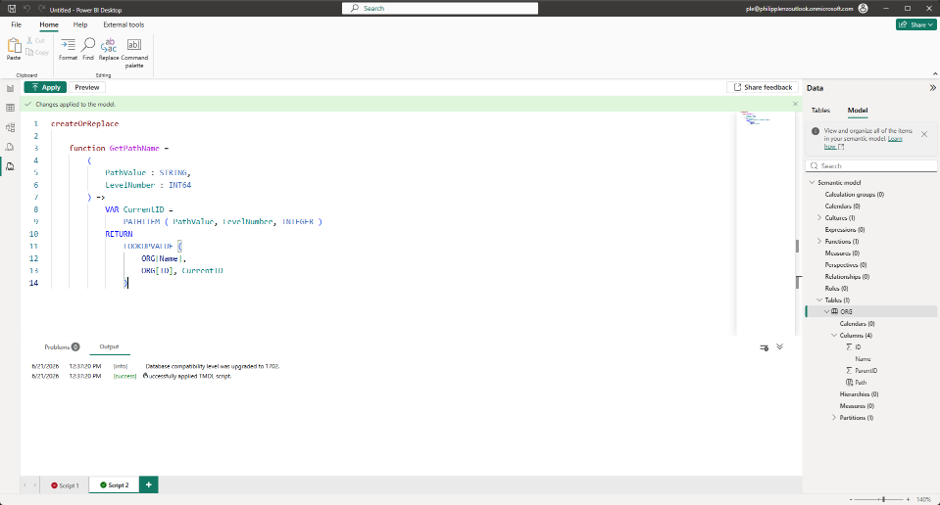
The following TMDL definition creates the function:
createOrReplace

    function GetPathName =
        (
            PathValue : STRING,
            LevelNumber : INT64
        ) =>
            VAR CurrentID =
                PATHITEM ( PathValue, LevelNumber, INTEGER )
            RETURN
                LOOKUPVALUE (
                    ORG[Name],
                    ORG[ID], CurrentID
                )
Why Are the Level Columns Required?
The PATH() function initially stores the hierarchy as a technical path, for example:
1|2|3|4|5
To make the hierarchy usable in Power BI for matrix visuals, slicers, and relationships, the path must be split into individual hierarchy levels:
- Level 1 = Company
- Level 2 = Department
- Level 3 = Team
- Level 4 = Sub-Team
- Level 5 = Employee
As a result, each hierarchy level receives its own column and can be filtered, grouped, and analyzed independently. The purpose of these calculated columns is therefore to transform the technical hierarchy path into a business-friendly organizational structure that can be used in reports and visualizations.
Level 1 = GetPathName ( ORG[Path], 1 )
Level 2 = GetPathName ( ORG[Path], 2 )
Level 3 = GetPathName ( ORG[Path], 3 )
Level 4 = GetPathName ( ORG[Path], 4 )
Level 5 = GetPathName ( ORG[Path], 5 )
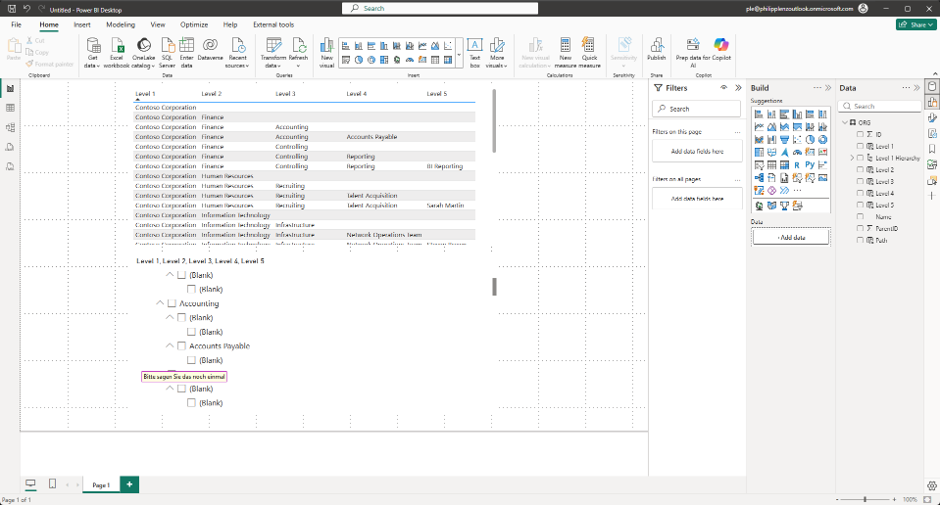
Identifying Leaf Nodes and Hiding Blank Values
Because not every organizational unit extends to the deepest hierarchy level, blank values are inevitable within the level columns. This occurs when different branches of the hierarchy have different depths.
For example, the branch:
Contoso Corporation
└─ Finance
   └─ Accounting
ends at Level 3, while another branch may continue to Level 5:
Contoso Corporation
└─ Finance
   └─ Controlling
      └─ Reporting
         └─ BI Reporting
Since the hierarchy visual expects values for all defined levels, Power BI automatically fills the missing levels with Blank. These blanks are then displayed as additional nodes within the hierarchy visual.
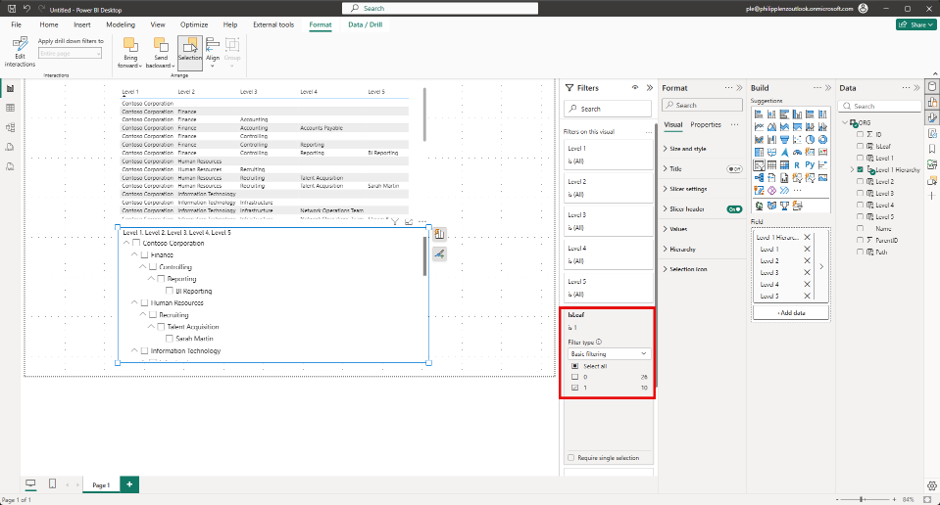
To hide these unwanted entries, an additional calculated column can be created:
IsLeaf = IF ( NOT ISBLANK ( ORG[Level 5] ), 1, 0 )This column identifies all leaf nodes—the lowest elements within a hierarchy branch—with the value 1. The hierarchy visual can then be filtered using IsLeaf = 1.
The advantage of this approach is that the unwanted (Blank) entries disappear, while Power BI continues to automatically display all parent levels of the hierarchy. As a result, the organizational structure remains fully intact and the visual becomes significantly cleaner and easier to understand.
Parent-child hierarchies provide a flexible way to represent complex organizational structures in Power BI. Using the
PATH() function, the complete hierarchy path is first generated and can then be split into individual hierarchy levels.The use of DAX User Defined Functions (UDFs) results in cleaner and more maintainable code. Instead of implementing the same logic separately for each hierarchy level, it is defined once and reused throughout the model. This makes hierarchies easier to extend and maintain over time.
TMDL (Tabular Model Definition Language) further enhances this approach by allowing model objects such as calculated columns, hierarchies, and functions to be defined as code. This improves version control, reusability, and the automation of Power BI models.
Because hierarchy branches often have different depths, blank values frequently appear within the level columns. By creating an additional
IsLeaf column, leaf nodes can be identified and used as a visual filter. This allows unwanted (Blank) entries to be hidden while preserving the complete hierarchy structure for report consumers.As a general best practice, hierarchies and relationships should be modeled as early as possible in the data source or data warehouse. Doing so reduces the complexity of the semantic model, improves maintainability, and often results in better performance.
The combination of
PATH(), DAX UDFs, TMDL, and leaf-node filtering provides a clean, reusable, and scalable solution for working with parent-child hierarchies in Power BI.