The new Power BI Desktop Bridge feature was recently released in preview. At first, I had read that it could only be used with Claude. However, that is not the case. Since I already have a ChatGPT subscription, I can also use the Power BI Desktop Bridge with Codex.
To get everything up and running, I first had to install several components in my PowerShell 7 environment.
The following components are required:
- Node.js
- Git
- OpenAI Codex CLI
- Microsoft Skills for Fabric
- Power BI Authoring Plugin
- Power BI Desktop Bridge CLI
After installation, you can verify that the required components are available by checking their versions:
node --version
npm --version
git --version
codex --version
powerbi-desktop --version
In addition, you obviously need a current version of Power BI Desktop.
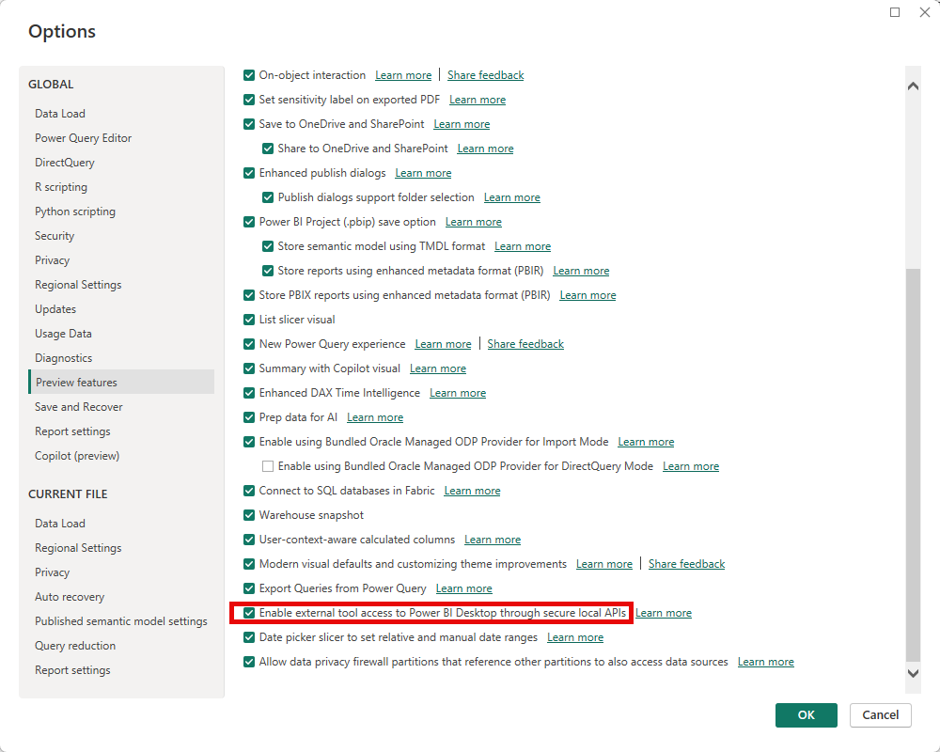
The Power BI Desktop Bridge feature must also be enabled in Power BI Desktop before it can be used.
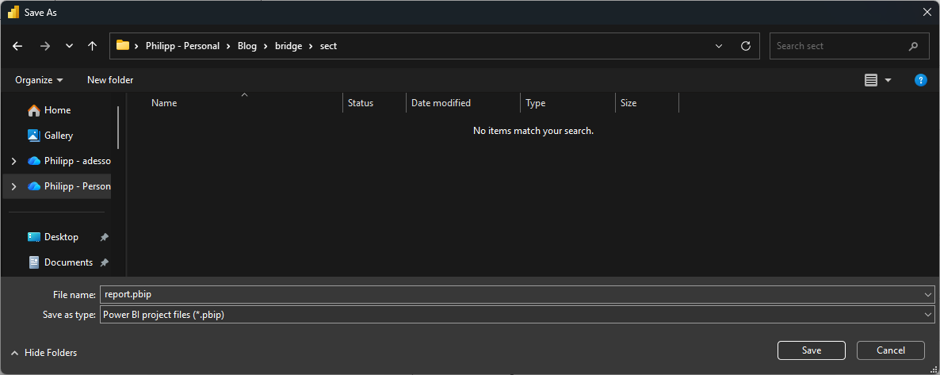
I then created a new project in Power BI:
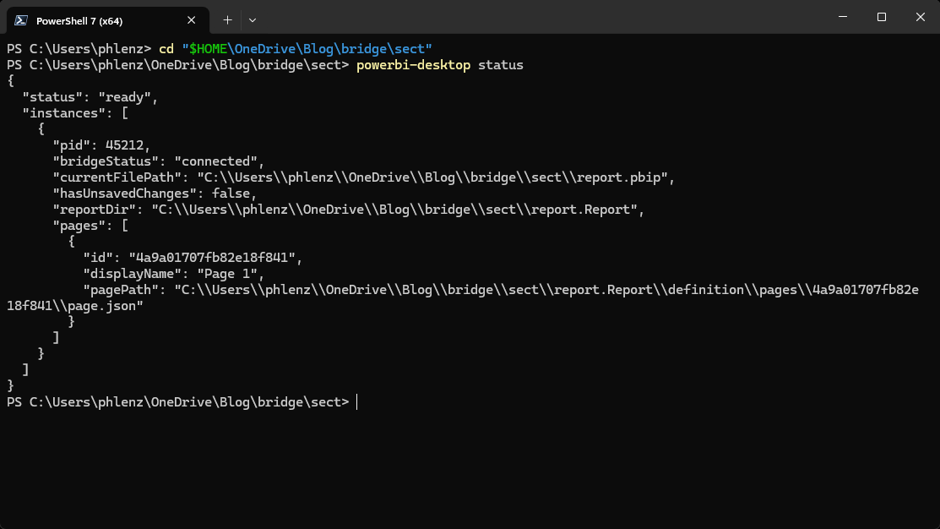
The next step is to check the status of the Power BI Desktop Bridge:
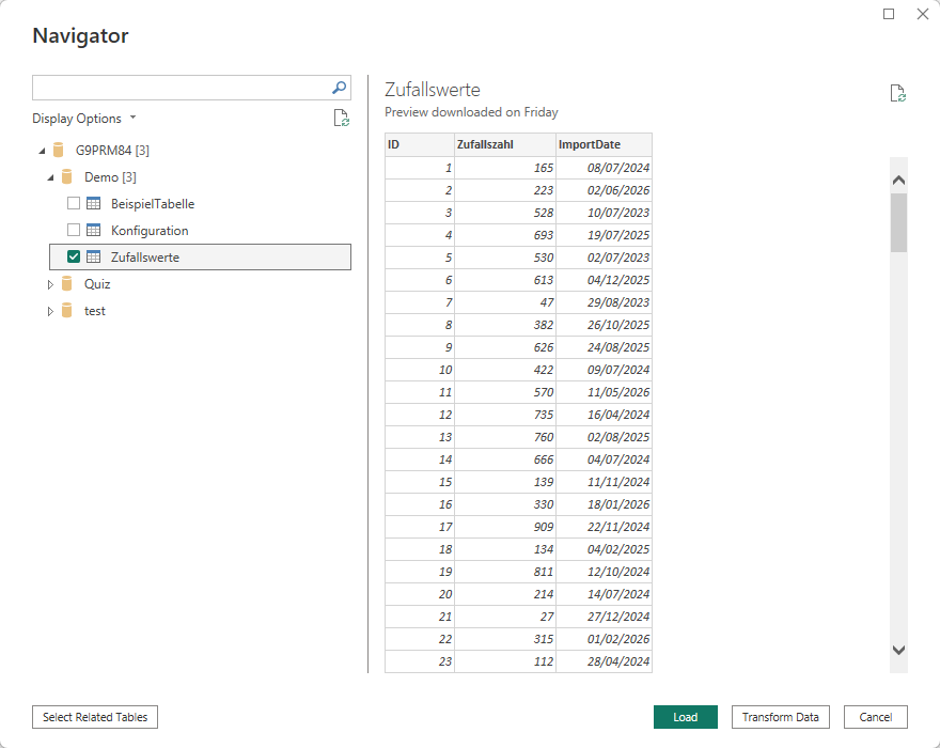
I then imported a simple table into my Power BI project.
I then started Codex from within my PowerShell 7 environment:
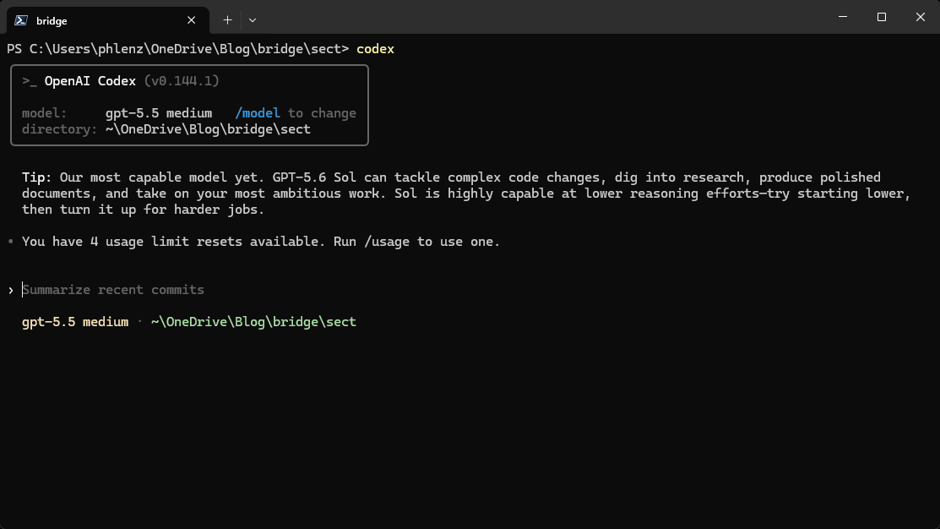
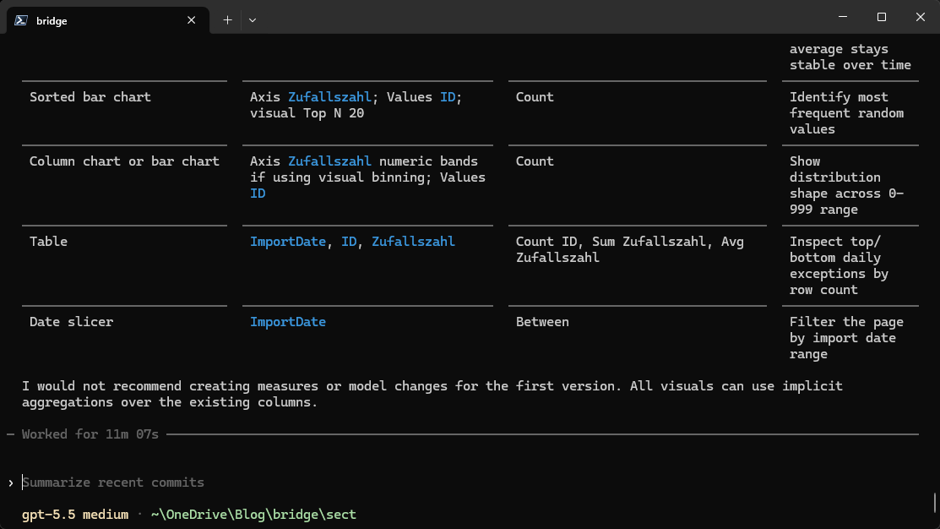
Since the previous command verified that the report was successfully opened and connected to the Power BI Desktop Bridge, I can now use Codex to analyze the simple semantic model, which currently consists of a single table.
Of course, the analysis would need to be more comprehensive for semantic models containing multiple tables and relationships between them.
Analyze the current Power BI project in read-only mode.

The semantic model contains exactly one imported SQL Server table.
There are:
- no relationships
- no explicit measures
- no calculated columns

Use the installed Power BI authoring skills.

Analyze only the existing table:
- table name
- all columns
- data types
- default summarization settings
- row count
- date ranges
- numeric minimum, maximum, sum and average
- distinct values for important categorical columns
- useful distributions and groupings

If possible, query the actual data through the local Power BI Desktop Analysis Services instance using read-only aggregated queries.

Then recommend a useful one-page Power BI report based on the actual data.

For every recommended visual, specify:
- visual type
- fields
- aggregation
- purpose

Do not modify the semantic model.
Do not create measures.
Do not create relationships.
Do not modify the report yet.
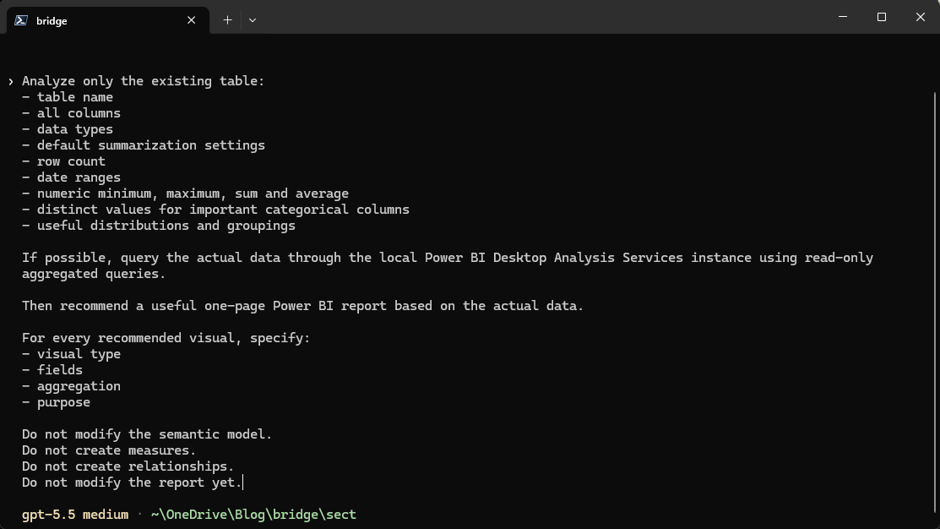
For the analysis, some sample data rows may be sent to Codex. This is important to keep in mind when working with sensitive or confidential data.
To further restrict data access, the prompt can be extended with the following instruction:
Do not send raw data or complete table contents to the model.
Nevertheless, it is recommended to use only sample or anonymized data when creating and testing Power BI reports with Codex.
Now, I only need to tell Codex what it should do. In this example, I want Codex to create a single report page containing several visualizations for the available metrics, along with a line chart.
I also explicitly instruct Codex not to make any changes to the semantic model.
The prompt can, of course, be much more detailed depending on the specific requirements. For example, additional instructions can be provided regarding the report layout, visual types, colors, formatting, or how individual data values should be displayed.
So, there are virtually no limits to how detailed the instructions can be. The more specific the prompt is, the better Codex can understand the requirements and create the Power BI report accordingly.
Create a simple one-page Power BI report using only the existing imported table.

Do not modify the semantic model.
Do not create measures, calculated columns, relationships, groups, or bins.

Create the following visuals on the existing Page 1:

Overview cards:
- Total number of records using Count of ID
- Minimum of Zufallszahl
- Maximum of Zufallszahl
- Average of Zufallszahl
- Earliest ImportDate
- Latest ImportDate

Line chart:
- X-axis: ImportDate
- Y-axis: Average of Zufallszahl

Design requirements:
- Use a clean 16:9 layout
- Place the overview cards at the top
- Place the line chart below the cards
- Use readable titles and labels
- Use only existing fields and implicit aggregations
- Do not create any additional visuals

Important:
- Modify only the existing Page 1
- Validate the PBIR files after editing
- Do not take a screenshot
Generating the report page may take several minutes. During the process, Codex may also ask for permission to perform certain operations or access external resources.
Once the generation process is complete, the report is reloaded in Power BI Desktop and displays the result based on the provided prompt:
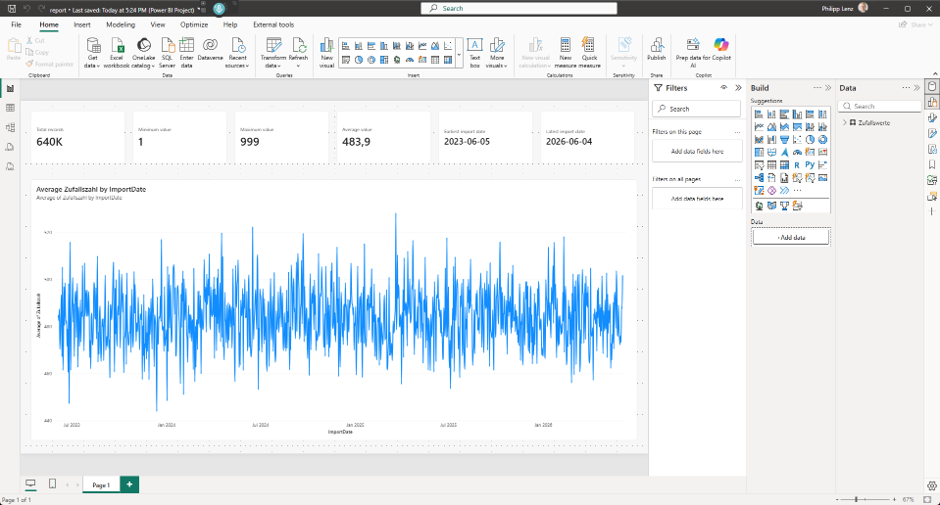
Conclusion
With this feature, Power BI reports can be created relatively quickly using Codex and the Power BI Desktop Bridge. It is also possible to make changes to the semantic model if required.
Ultimately, the quality of the result depends heavily on how clearly and precisely the requirements are defined. A well-structured and detailed prompt is the key to achieving the desired result.